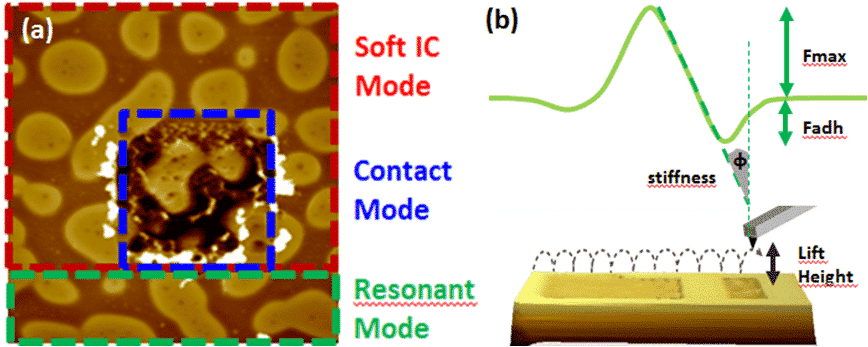
Soft Intermittent Contact : 3rd AFM mode (Soft IC)
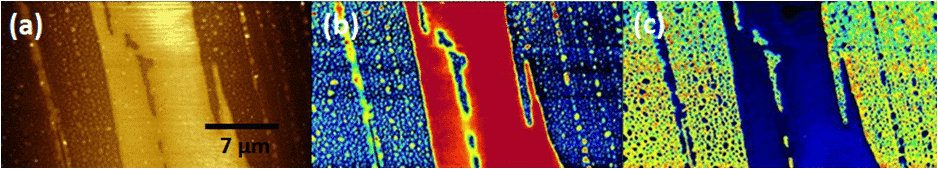
![]() The advantages of contact and resonant AFM modes without the drawbacks
The advantages of contact and resonant AFM modes without the drawbacks
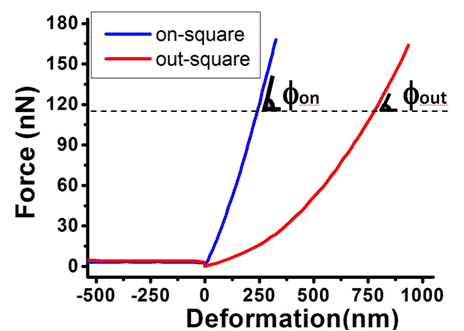
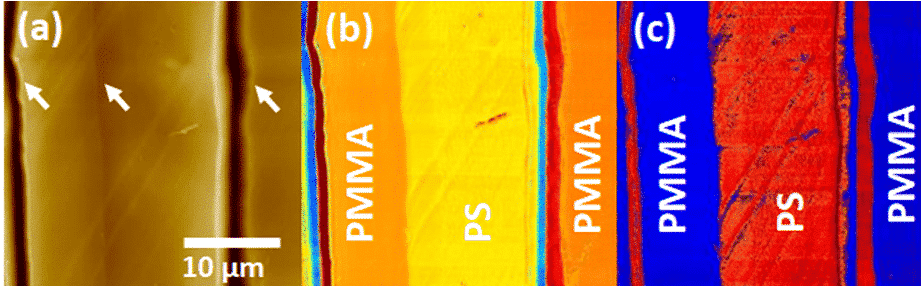
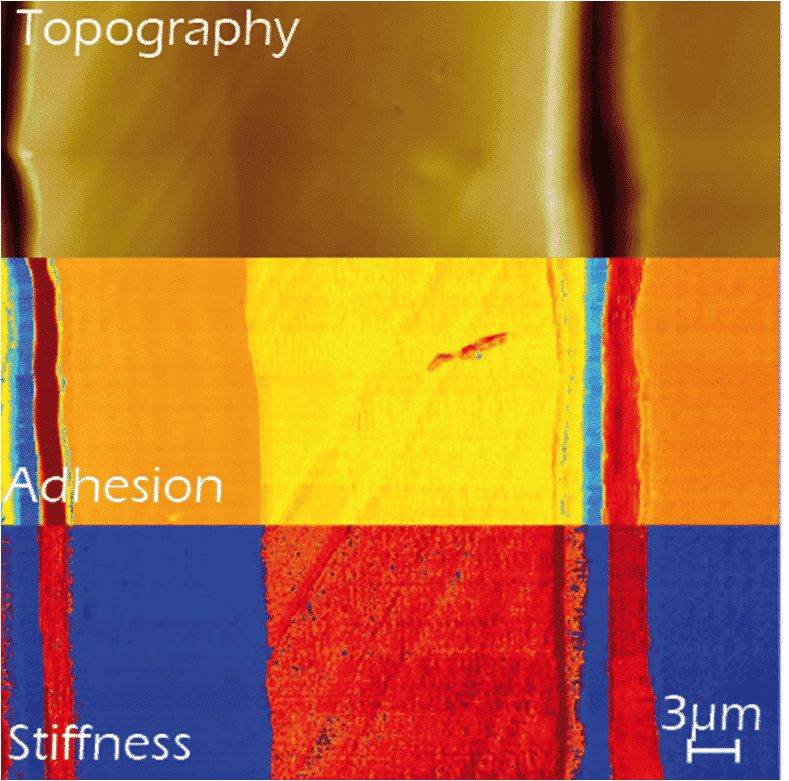
![]() Mechanical properties : Adhesion, Stiffness, Young’s Modulus
Mechanical properties : Adhesion, Stiffness, Young’s Modulus
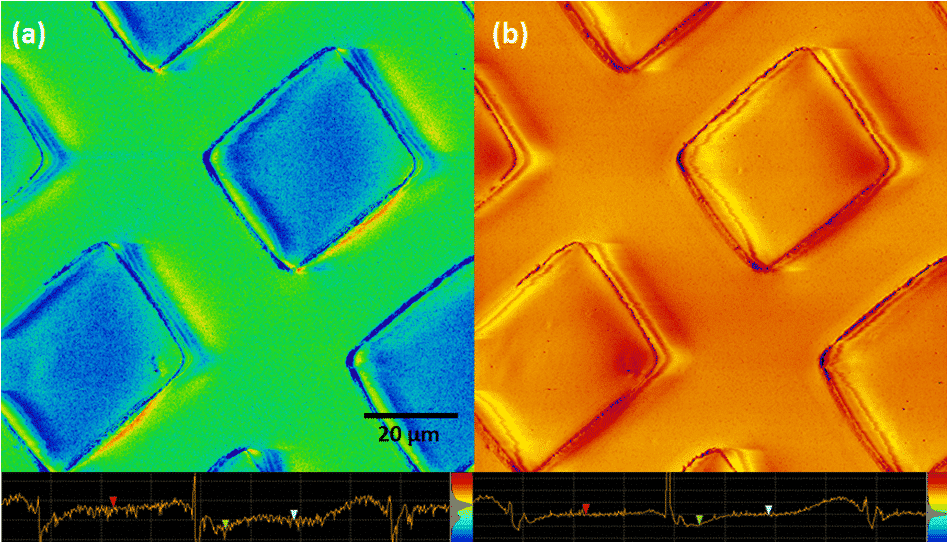
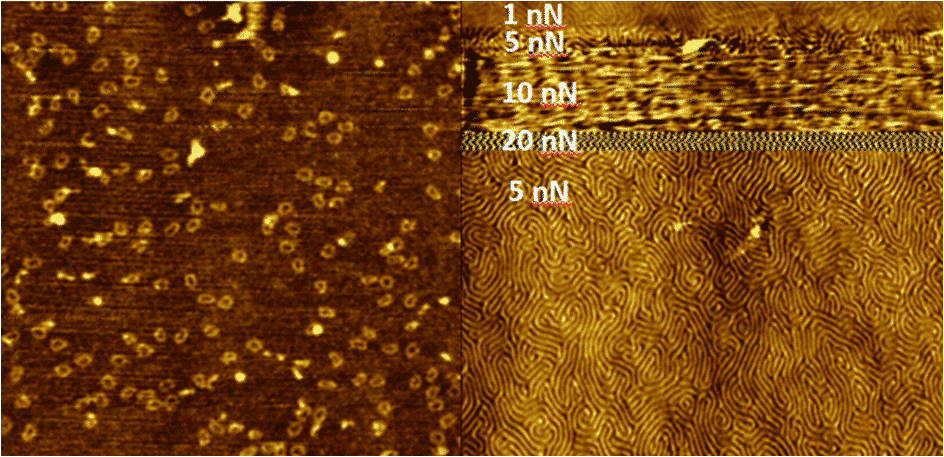
![]() Constant force = quantitative measurement
Constant force = quantitative measurement
![]() Compatible with : ResiScope, SThM, PFM, C-AFM…
Compatible with : ResiScope, SThM, PFM, C-AFM…